File:Receiver Operating Characteristic.png

From formulasearchengine
Jump to navigation Jump to search
Original file (720 × 540 pixels, file size: 19 KB, MIME type: image/png)

This file is from Wikimedia Commons and may be used by other projects. The description on its file description page there is shown below.

File:ROC curves.svg is a vector version of this file. It should be used in place of this PNG file when not inferior.

File:Receiver Operating Characteristic.png → File:ROC curves.svg

For more information, see Help:SVG.

In other languages
Alemannisch  العربية  беларуская (тарашкевіца)  български  বাংলা  català  нохчийн  čeština  dansk  Deutsch  Ελληνικά  English  British English  Esperanto  español  eesti  euskara  فارسی  suomi  français  Frysk  galego  Alemannisch  עברית  हिन्दी  hrvatski  magyar  հայերեն  Bahasa Indonesia  Ido  italiano  日本語  ქართული  한국어  lietuvių  македонски  മലയാളം  Bahasa Melayu  မြန်မာဘာသာ  norsk bokmål  Plattdüütsch  Nederlands  norsk nynorsk  norsk  occitan  polski  prūsiskan  português  português do Brasil  română  русский  sicilianu  Scots  slovenčina  slovenščina  српски / srpski  svenska  தமிழ்  ไทย  Türkçe  татарча / tatarça  українська  vèneto  Tiếng Việt  中文  中文(中国大陆)  中文(简体)  中文(繁體)  中文(马来西亚)  中文(新加坡)  中文(臺灣)  +/−
New SVG image

Summary

Description
Deutsch: Receiver Operating Characteristic
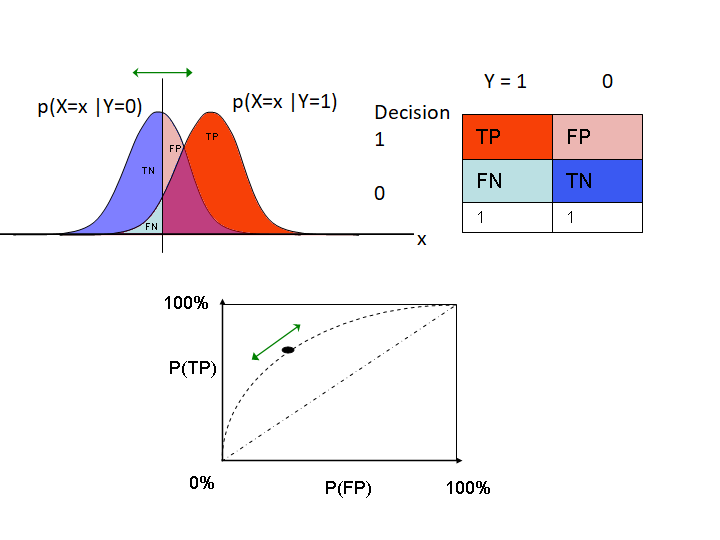
  • Oben links: Zwei unterschiedliche Populationen (z.B. von kürzlich Grippeinfizierten, die aber gesund bleiben und Infizierten, bei den die Grippe zum Ausbruch kommt), werden in einem kontinuierlichen Merkmal (z.B. Körpertemperatur) vermessen. Die linke Kurve stelle die Stichproben-Temperaturverteilung bei resistenten Virenträgern dar, die rechte dieselbe der in Kürze zu Krankheitsfällen werdenden. Wie in der Realität zu erwarten, überlappen sich die Messwerten der Teilpopulationen. Ein Trennkriterium (gerade Linie, sagen wir: 38,6 Grad Celsius) wird also immer einen Anteil beider Teilpopulationen falsch einstufen, entweder falsch positiv (FP, rosa Fläche) oder falsch negativ (FN, hellblaue Fläche). Die Anteile variieren je nach Lage des Trennkriteriums (grüner Pfeil: nach links - FN kleiner, FP größer; nach rechts: umgekehrt). Die "lila" Fläche ist eigentlich rot aber "durchscheinend".
  • Oben rechts: Der Anteil der True Positives (TP=zu Recht als positiv eingestufte) und der False Negatives (FN=zu Unrecht als negativ eingestufte) addiert sich zu 1 bzw. 100%; das ist die Fläche unter der rechten Glockenkurve. Gleichermaßen gilt: Anteil True Negatives (TN) plus Anteil False Positives ergibt 100%, nämlich die Fläche unter der linken Kurve.
  • Unten: ROC-Kurve (TP gegen FP aufgetragen). Sind beide Verteilungen identisch, so ist die Kurve die Winkelhalbierende, d.h. die Rate FP ist bei Variation des Trennkriteriums immer gleich der Rate TP. Ideale Trennschärfe, d.h. völlige Nichtüberlappung der Verteilungen wäre im ROC-Diagramm durch einen Verlauf Y-Achse aufwärts, obere X-Achse quer (0% FP, 100% TP im gesamten Bereich gekennzeichnet). In der Realität finden sich Kurven im Zwischenbereich, bei denen eine Erhöhung der TP in einem gewissen Bereich eine relativ geringere Erhöhung der FP zur Folge hätte. Achtung! Die Verschiebungsrichtung des Trennkriteriums (grüner Punkt) ist in dieser Auftragung entgegengesetzt der Richtung im l.o. Teildiagramm wie durch die Größe der Pfeilköpfe angedeutet, d.h. Punkt nach links = Trennlinie nach rechts.
Date
Source Own work using: PowerPoint
Author kakau

Licensing

GNU head Permission is granted to copy, distribute and/or modify this document under the terms of the GNU Free Documentation License, Version 1.2 or any later version published by the Free Software Foundation; with no Invariant Sections, no Front-Cover Texts, and no Back-Cover Texts. A copy of the license is included in the section entitled GNU Free Documentation License.
w:en:Creative Commons
attribution share alike
This file is licensed under the Creative Commons Attribution-Share Alike 3.0 Unported license.
You are free:
  • to share – to copy, distribute and transmit the work
  • to remix – to adapt the work
Under the following conditions:
  • attribution – You must give appropriate credit, provide a link to the license, and indicate if changes were made. You may do so in any reasonable manner, but not in any way that suggests the licensor endorses you or your use.
  • share alike – If you remix, transform, or build upon the material, you must distribute your contributions under the same or compatible license as the original.
This licensing tag was added to this file as part of the GFDL licensing update.

Original upload log

Transferred from de.wikipedia to Commons by Jutta234 using CommonsHelper.

The original description page was Operating Characteristic.png here. All following user names refer to de.wikipedia.
  • 2006-01-31 14:49 Kku 720×540× (16721 bytes) selbstgepinselt mit powerpoint, september 2003

Captions

Add a one-line explanation of what this file represents

Items portrayed in this file

depicts

September 2003

File history

Click on a date/time to view the file as it appeared at that time.

Date/TimeThumbnailDimensionsUserComment
current21:20, 8 August 2021Thumbnail for version as of 21:20, 8 August 2021720 × 540 (19 KB)wikimediacommons>Biggerj1add labels on axis and description of what is visible

There are no pages that use this file.