File:M2andInflation.png
Jump to navigation
Jump to search
Size of this preview: 800 × 581 pixels. Other resolutions: 320 × 232 pixels | 640 × 465 pixels | 1,024 × 744 pixels | 1,103 × 801 pixels.
Original file (1,103 × 801 pixels, file size: 71 KB, MIME type: image/png)
Summary
| Description |
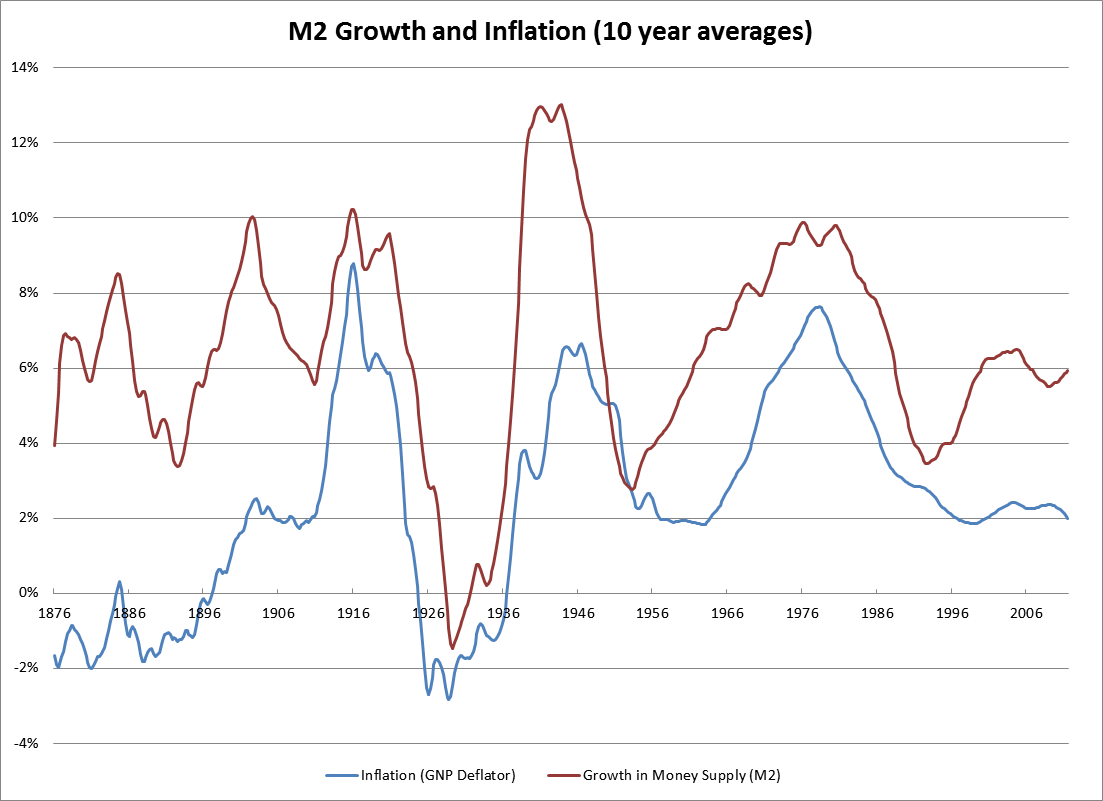
English: Chart of M2 money supply growth and inflation as measured by the GNP price deflator. Data from 1875 to 1959 are taken from Appendix B of The American Business Cycle: Continuity and Change (edited by Robert Gordon). Data available here: http://www.nber.org/data/abc/. Data from 1959 onward are taken from the Fred database. Series IDs GNPDEF and MSNS.
See for similar charts: http://research.stlouisfed.org/publications/review/98/11/9811wd.pdf and https://www.clevelandfed.org/Research/Commentary/1999/0801.pdf |
|||
| Date | ||||
| Source | Own work | |||
| Author | Bkwillwm | |||
| Other versions |
|


Licensing
I, the copyright holder of this work, hereby publish it under the following licenses:


This file is licensed under the Creative Commons Attribution-Share Alike 3.0 Unported license.
- You are free:
- to share – to copy, distribute and transmit the work
- to remix – to adapt the work
- Under the following conditions:
- attribution – You must give appropriate credit, provide a link to the license, and indicate if changes were made. You may do so in any reasonable manner, but not in any way that suggests the licensor endorses you or your use.
- share alike – If you remix, transform, or build upon the material, you must distribute your contributions under the same or compatible license as the original.

|
Permission is granted to copy, distribute and/or modify this document under the terms of the GNU Free Documentation License, Version 1.2 or any later version published by the Free Software Foundation; with no Invariant Sections, no Front-Cover Texts, and no Back-Cover Texts. A copy of the license is included in the section entitled GNU Free Documentation License. |
You may select the license of your choice.
File history
Click on a date/time to view the file as it appeared at that time.
| Date/Time | Thumbnail | Dimensions | User | Comment | |
|---|---|---|---|---|---|
| current | 01:10, 22 January 2012 | | 1,103 × 801 (71 KB) | wikimediacommons>Bkwillwm | {{Information |Description ={{en|1=Chart of M2 money supply growth and inflation as measured by the GNP price deflator. Data from 1875 to 11959 are taken from Appendix B of ''The American Business Cycle: Continuity and Change'' (edited by Robert Gordo |
File usage
There are no pages that use this file.
