File:Bell.svg

Summary
| Description |
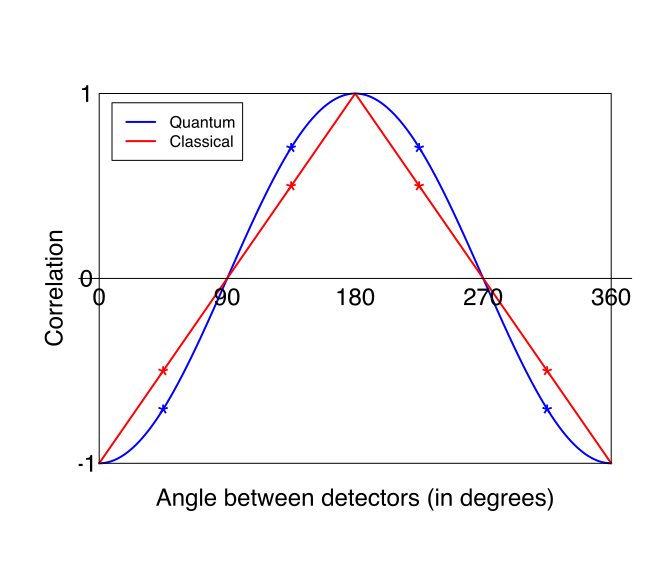
The best possible local realist imitation (red) for the quantum correlation of two spins in the singlet state (blue), insisting on perfect anti-correlation at zero degrees, perfect correlation at 180 degrees. Many other possibilities exist for the classical correlation subject to these side conditions, but all are characterized by sharp peaks (and valleys) at 0, 180, 360 degrees, and none has more extreme values (+/-0.5) at 45, 135, 225, 315 degrees. These values are marked by stars in the graph, and are the values measured in a standard Bell-CHSH type experiment: QM allows , local realism predicts or less. svg("Bell.svg", width = 7, height = 6) plot(0, 0, xlim = c(0, 2), ylim = c(-1, 1), type = "n", axes = FALSE, ylab="", xlab = "", mar = c(1, 1, 1, 1)) x <- seq(from = 0, to = 2, length = 181) lines(x, -cos(pi*x), col = "blue", lwd = 2) lines(c(0, 1, 2), c(-1, 1, -1), col = "red", lwd = 2) lines(c(0, 2, 2, 0,0), c(-1, -1, 1, 1, -1)) abline(h=0) legend(0.05, 0.95, legend = c("Quantum", "Classical"), lwd = c(2, 2), col = c("blue", "red")) text(c(0, 1/2, 1, 3/2, 2), -0.1, labels = c(0,90, 180, 270, 360), cex = 1.5 ) text(-0.05, c(-1, 0, 1), c(-1, 0, 1), cex=1.5) text(-0.2, 0, "Correlation", srt = 90, cex = 1.5, pos = 1, xpd = NA) text( 1.0, -1.1, "Angle between detectors (in degrees)", cex = 1.5, pos = 1, xpd = NA) graphics.off(); |
| Source | Richard Gill, 22 December 2013, drawn with R |
| Author |
Licensing


- You are free:
- to share – to copy, distribute and transmit the work
- to remix – to adapt the work
- Under the following conditions:
- attribution – You must give appropriate credit, provide a link to the license, and indicate if changes were made. You may do so in any reasonable manner, but not in any way that suggests the licensor endorses you or your use.
- share alike – If you remix, transform, or build upon the material, you must distribute your contributions under the same or compatible license as the original.
Original upload log

| Date/Time | Dimensions | User | Comment |
|---|---|---|---|
| 2013-12-23 09:08:43 | 630× 540× | Gill110951 | added stars marking correlations found in Bell-CHSH experiments xs <- c(1/4, 3/4, 5/4, 7/4) points(xs, -cos(pi*xs), col = "blue", pch = "*", cex = 2) ys <- c(-1/2, 1/2, 1/2, -1/2) points(xs, ys, col = "red", pch = "*", cex = 2) |
| 2013-12-22 17:48:29 | 630× 540× | Gill110951 | improved size and placement of text |
| 2013-12-22 17:27:28 | 630× 630× | Gill110951 | Richard Gill, 22 December 2013, drawn with following R script svg("Bell.svg") plot(0, 0, xlim = c(0, 2), ylim = c(-1, 1), type = "n", axes = FALSE, ylab="Correlation", xlab = "Angle between detectors (in degrees)", mar = c(1, 1, 1, 1)) x... |
File history
Click on a date/time to view the file as it appeared at that time.
| Date/Time | Thumbnail | Dimensions | User | Comment | |
|---|---|---|---|---|---|
| current | 08:13, 31 December 2016 | | 630 × 540 (55 KB) | wikimediacommons>FastilyClone | Transferred from en.wikipedia (MTC!) |

File usage
There are no pages that use this file.
