File:Atan2-discontinuity.svg
Jump to navigation
Jump to search

Size of this PNG preview of this SVG file: 640 × 480 pixels. Other resolutions: 320 × 240 pixels | 1,024 × 768 pixels | 1,280 × 960 pixels | 2,560 × 1,920 pixels.
Original file (SVG file, nominally 640 × 480 pixels, file size: 20 KB)
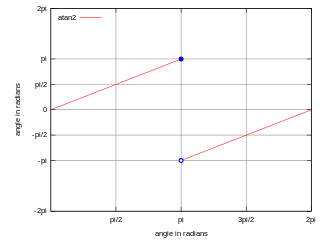
| Description | Graph of the function , as θ ranges from 0 to 2π. Notice the discontinuity at θ = π. |
| Date | (UTC) |
| Source | |
| Author |
|

I, the copyright holder of this work, hereby publish it under the following licenses:
This file is licensed under the Creative Commons Attribution-Share Alike 3.0 Unported license.
- You are free:
- to share – to copy, distribute and transmit the work
- to remix – to adapt the work
- Under the following conditions:
- attribution – You must give appropriate credit, provide a link to the license, and indicate if changes were made. You may do so in any reasonable manner, but not in any way that suggests the licensor endorses you or your use.
- share alike – If you remix, transform, or build upon the material, you must distribute your contributions under the same or compatible license as the original.

|
Permission is granted to copy, distribute and/or modify this document under the terms of the GNU Free Documentation License, Version 1.2 or any later version published by the Free Software Foundation; with no Invariant Sections, no Front-Cover Texts, and no Back-Cover Texts. A copy of the license is included in the section entitled GNU Free Documentation License. |
You may select the license of your choice.
Gnuplot script
 # Output to svg
 set terminal svg size 640 480
 set output "Atan2-discontinuity.svg"

 # Use lots of samples
 set samples 1000

 # Configure the graph
 set xlabel "angle in radians"
 set ylabel "angle in radians"
 set key left top
 set grid

 # (Manually) set the tics so they say "pi/2", "pi", etc.
 set xtics ("pi/2" pi/2, "pi" pi, "3pi/2" 3*pi/2, "2pi" 2*pi)
 set ytics ("-2pi" -2*pi, "-pi" -pi, "-pi/2" -pi/2, "0" 0, "pi/2" pi/2, "pi" pi, "2pi" 2*pi)

 # Plot
 plot [0:2*pi][-2*pi:2*pi] atan2(sin(x), cos(x)) title "atan2"
Some post processing done in Inkscape, specifically removal of the ugly nonexistent vertical line at θ = π and insertion of the blue circles.
Original upload log
This image is a derivative work of the following images:
- File:Atan2.PNG licensed with Cc-by-sa-3.0, GFDL
- 2009-02-05T16:56:20Z Adam majewski 640x480 (7575 Bytes) {{Information |Description={{en|1=Atan2 function}} |Source=Own work by uploader |Author=[[User:Adam majewski|Adam majewski]] |Date=2009.02.05 |Permission= |other_versions= }}
Uploaded with derivativeFX
File history
Click on a date/time to view the file as it appeared at that time.
| Date/Time | Thumbnail | Dimensions | User | Comment | |
|---|---|---|---|---|---|
| current | 08:09, 19 May 2010 | | 640 × 480 (20 KB) | wikimediacommons>Kpengboy | Made the upper circle at π filled in, because atan2 is defined there |
File usage
There are no pages that use this file.